Software Tutorial
CV Laboratory aims to support the work in laboratories specifically the process of developing new formulations. The typical process includes the setup of design of experiments, evaluation of the experiments, generating models on basis of the evaluated experiments and the suggestion new and better formulations. The diagram below illustrates such a workflow.


Setting up a design of experiment includes some challenges which are special to this kind of task. Of course, the design of experiments should provide enough information to be able of generating models which can predict the outcome of new experiments. Additional challenges are the availability of materials with associated costs and the time available to execute the experiments. Thus, CV laboratory supports the creation of design of experiments which meet all constraints and goals.
The results of the experiments need to be visualised, and models are generated on the basis of the experiments. CV Laboratory provides a very easy to use way to get the models and use them to generate new suggestions for experiments which are optimal regarding the desired properties.
In addition, the possibility to manage material data is needed in order to achieve all of above.
Installation and start
Are you interested in using this software? Download here.
First, you can find the file of the software on the page mentioned above, as you need to have the access details for such download. CV Laboratory is deployed as a zip file for Windows. The current version is cv-laboratory-build-241119.zip. Additionally, you need the license for EnXylaScope partners, cv-lab-enxylascope-divis.lic. Unzip the zip file in any directory from where you want to start working and also copy the license file to any directory. Now you need to set an environment variable LMX_LICENSE_PATH to the directory where copied the license file, e.g. LMX_LICENSE_PATH=C:temp if c:temp is the location of the license file. Now you can start CV Laboratory with cv-laboratory.bat.

Tutorial
The tutorial guides you through the essential steps of working efficiently with CV Laboratory.
01. Material management
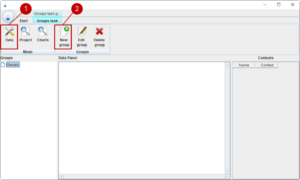
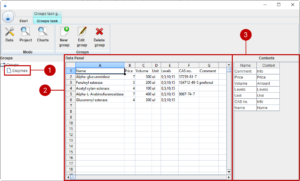
The availability and the associated cost of materials is very important for setting up optimal design of experiments. In this prototypic version a simple data management module has been integrated. In the future it is possible that the module is extended to connect with common enterprise-resource-planning systems. In many cases a sub-selection of materials from the same function group is used in a formulation. For example, you want to use one enzyme in a certain concentration in your formulation, but you have different enzymes available. Thus, we introduce groups of materials. Let us start with adding a new group of enzymes. On the upper left side, you recognise the different modules of the tool. We start with the data management module (1). We add a new group with (2).
A group is defined in a table format. First, we need to define the header in the first row of the table. The actual names in the header can be feely chosen, but we need certain information like the name, cost, available amount and levels in order to create designs of experiments.
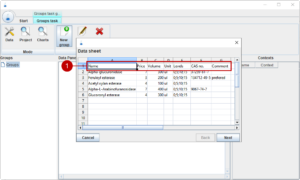
For now, we have five enzymes with different properties which we want to use for our experiments.
| Name | Price | Volume | Unit | Levels | CAS no. | Comment |
|---|---|---|---|---|---|---|
| Alpha-glucuronidase | 7.0 | 300.0 | ul | 0;5;10 | 37259-81-7 | |
| Feruloyl esterase | 3.0 | 200.0 | ul | 0;5;10 | 134712-49-5 | prefered |
| Acetyl xylan esterase | 4.0 | 100.0 | ul | 0;5;10 | ||
| Alpha-L-Arabinofuranosidase | 7.0 | 400.0 | ul | 0;5;10 | 9067-74-7 | |
| Glucoronyl esterase | 4.0 | 300.0 | ul | 0;5;10 |
Name
Glucoronyl esterase
Price
4.0
Volume
300.0
Units
ul
Levels
0;5;10
CAS no.
–
Comment
–
Name
Glucoronyl esterase
Price
4.0
Volume
300.0
Units
ul
Levels
0;5;10
CAS no.
–
Comment
–
Name
Glucoronyl esterase
Price
4.0
Volume
300.0
Units
ul
Levels
0;5;10
CAS no.
–
Comment
–
| Name | Unique identifier | Only allowed once |
| Amount | Available amount | Only allowed once |
| Price | Price information | Only allowed once |
| Unit | Unit information | Only allowed once, optional |
| Levels | The intended amounts which are allowed in the formulation.
Zero indicates it can be omitted. |
Only allowed once |
| Info | Any additional information or descriptions | Any number of columns |
Here we need to map the volume header to amount context (4).
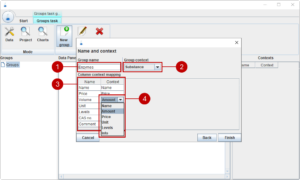
We can now finish the dialog, and we see that a new group enzymes (1) shows up in the group tree. On the right side, we see the table of view (2) and the associated contexts (3)
Of course, you add further groups, edit the groups or delete any unnecessary groups.
02. Setting up design of experiments
 Starting a project
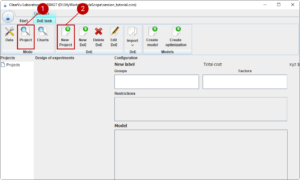
Before we start experimenting, we need to create a project. A project contains all steps from design of experiments to an optimization regarding a certain approach. In order to start, we change to the project module (1) and we create a new project with (2).
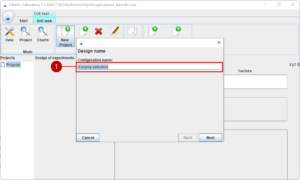
First, we think of a name for our new project (1).
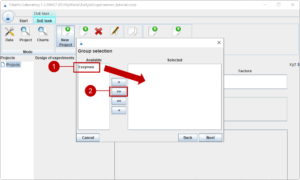
On the next page, we select the material/equipment groups. For now, we select our enzyme group (1) using (2) which moves all groups into the selected area.
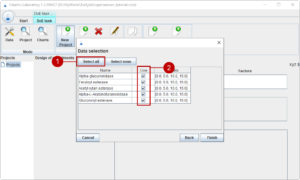
On the last page, we can make a sub-selection of the materials in the groups (2). We want to test all materials und thus use (1) to select all.
Preparing a design of experiments
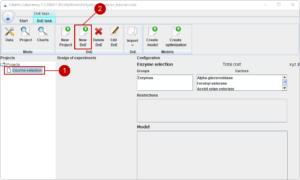
In order to start working on our project, we select the project in the tree (1) and start a new design of experiment with (2).
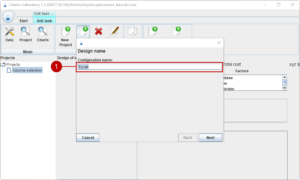
First, we think of a name for our first design of experiments (1).
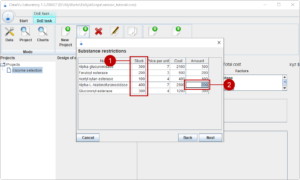
The next page shows the available amounts of the materials (1). We can restrict the design of experiments to not use all of the available amounts, like only using a maximal half of Alpha-L-Arabinofuranosidase (2).
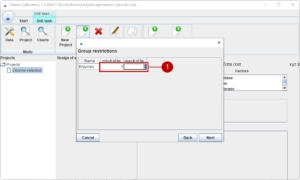
Continuing on the next page, we can add group restrictions. We can set how many enzymes we need at least in our formulation and the maximal number of combinations of enzymes. Of course, we need at least one enzyme, but we do not want to combine more than two (1).
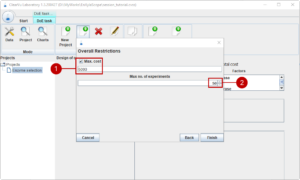
Finally, we set that we want the total cost of the design of experiments to not much more than 5000 (1) and we are able to do 50 experiments (2).
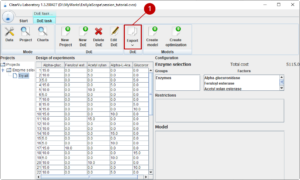
After we finish the dialog, the generation of the design of experiments starts indicated by a wait dialog. When the design of experiments is ready, we can have a look at it and export it (1) to start experimenting in the laboratory.
03. Importing and analysing results
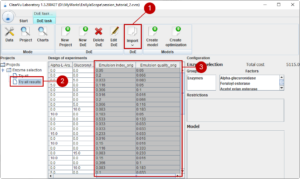
In this example we have two characteristics of interest: the emulsion index and the emulsion quality, both values between 0 (very poor/bad, 1 optimal). For each experiment we record our results and add the values as two new columns to our design of experiment file. Now we can import (1) the results back to the CV Laboratory. The table is attached to our project (2) and we see our characteristics attached to the table (3). Note that the names have the postfix “_orig” showing that these are the original values.
We can have a closer look at our data with the chart module (1). Here, we have a grid which can be filled with different charts. In this example, we look at the distribution of Alpha-glucuronidase with a bar chart, at the emulsion index with a box plot and we look for a correlation between Glucuronyl esterase and the emulsion quality using a scatter chart.
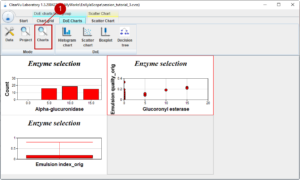
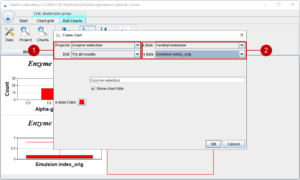
A chart can be added or edited with a dialog where you choose the project and the design of experiments (1) on the one hand and the parameter (2) on the other hand. Additionally, the chart title can be set, and you can change the default colour.
04. Generating models
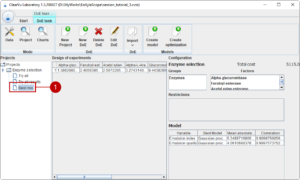
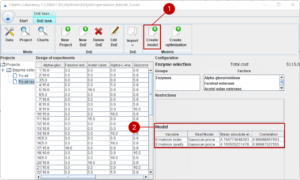
We are satisfied with the quality of the data and our results. Now we continue with generating models which can predict the outcome of new experiments with the aim to use the models to generate an optimal formulation. We select our design of experiments with the results and generate the models with (1). The tool tests different modelling approaches, optimises each and selects the best suited model. The quality of the resulting model is summarized in table (2).
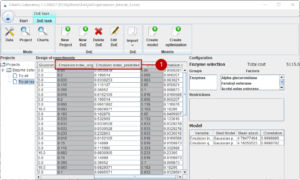
You will notice that all tables from this project now have an original and predicted column for each result (1). If you generate a new design of experiments or switch to the initial design of experiments, you get predictions for the result parameter.
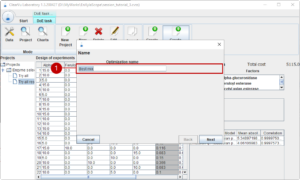
05. Optimisation
The final step is to use the models for an optimisation. We start the optimisation with choosing a name (1).
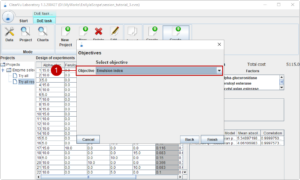
Then, we select the parameter to be optimized (1).
The optimal formulation is stored as a new design of experiments under the name of the optimization (1). The predicted outcome is attached, and you can test the suggested formula in the laboratory.